

Power Query Function for Dense Ranking
Power Query Function for Dense Ranking
Recently I was having issues writing a measure in DAX to rank items properly (not an issue with the DAX, but in my understanding of the DAX). I did some searching and came across Chris Webb’s article that had a nice implementation of ranking using Power Query.
The technique he proposed uses Power Query to:
- sort a table by the column you want to rank by,
- add an index column to the table
The result of his code would give you a unique ranking number for every row, even if there are ties.

He went on to show how you could get grouped rankings, such as by month: you can add a step at the beginning to group by those columns first (using the All Rows aggregation), then ungroup them at the end. The index value gets reset for each group of rows, and within the group, ties get a different rank value.
I wanted to adapt his technique, but where rows with ties would have the same rank. Also, I wanted rows with a null value in the column to rank by to get a null ranking.
Here’s my adaptation:
- Select rows with a null value in the column to rank into a table
- Select rows with a non-null value in the column into a separate table
- Add a new column (with null values) to the table with null rows
- Group the non-null table by the ranking column
- add an index column to the grouped table
- ungroup the table
- combine the null table with the ungrouped table
Step 2 excludes those rows in the table with a null value in the column you want to rank by. Step 1 and 3 keeps these null value rows to put back in the table after the non-null rows have been ranked. Step 4 allows me to have ties with the same ranking value.
I wrote it as a function. When I need to rank a table without grouping it, it’s a simple call to the RankFunction. When I want to have grouped rankings, I group the table first (using the All Rows aggregation), then use Table.TransformColumns to rank each group’s rows.
let  RankFunction = (tabletorank as table, sortcolumn as text, newcolumn as text) as table =>
  let
    NullRows = Table.SelectRows(tabletorank, each (Table.Column(_, sortcolumn) = null)),
    NullWithIndex = Table.AddColumn(NullRows, newcolumn, each null, Int64.Type),

    NotNullRows =Table.SelectRows(tabletorank, each (Table.Column(_, sortcolumn) <> null)),
    DenseGrouping = Table.Group(NotNullRows, {sortcolumn}, {{"Groupedrows", each _, type table}}),
    SortRows = Table.Sort(DenseGrouping,{{sortcolumn, Order.Descending}}),

    AddIndex = Table.AddIndexColumn(SortRows, newcolumn, 1, 1),
    ChangedType = Table.TransformColumnTypes(AddIndex,{{"Employer Rate Rank", Int64.Type}}),

    DenseUngrouping = Table.ExpandTableColumn(ChangedType,"Groupedrows",
        List.RemoveMatchingItems(Table.ColumnNames(NotNullRows), {sortcolumn})),

    AggregateRows =  Table.Combine( { NullWithIndex, DenseUngrouping } )
  in
    AggregateRows
in RankFunction
Here is a sample of how I use the RankFunction to rank an Employer table by their AssessmentRate, first by PayrollYear, then by PayrollYear and Industry:
let
Source = GetData("Employer"),
#"Grouped Rows" = Table.Group(Source, {"PayrollYear"}, {{"AllRows", each _, type table}}),
AddedRank = Table.TransformColumns(#"Grouped Rows", {"AllRows", each RankFunction(_, "AssessmentRate","Employer Rate Rank")}),
#"Expanded AllRows" = Table.ExpandTableColumn(AddedRank, "AllRows", {...column names...}, {{...column names...}),
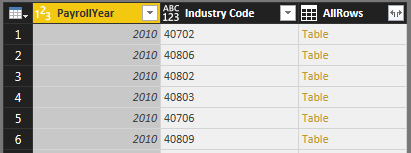
#"Grouped Rows1" = Table.Group(#"Expanded AllRows", {"PayrollYear", "Industry Code"}, {{"AllRows", each _, type table}}),
#"Grouped Rows2" = Table.TransformColumns(#"Grouped Rows1", {"AllRows",
each RankFunction(_, "AssessmentRate","Employer Rate Rank (Industry)")}),
#"Expanded AllRows1" = Table.ExpandTableColumn(#"Grouped Rows2", "AllRows", {...column names...}, {...column names...}),
in
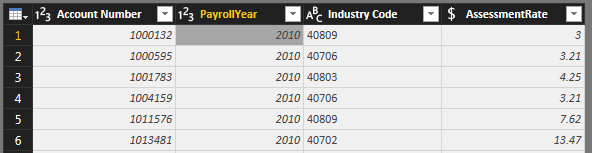
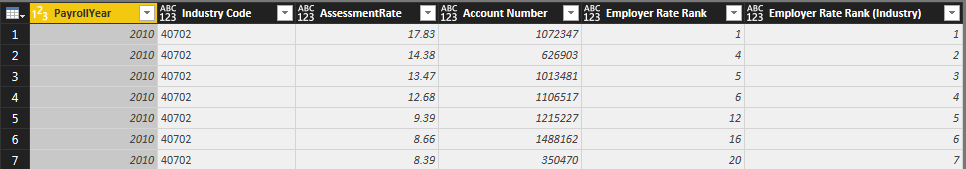
#"Expanded AllRows1"Here is the source table:
I group it by Payroll Year, then call the RankingFunction using Table.TransformColumns on the AllRows column (each row has a table of rows)
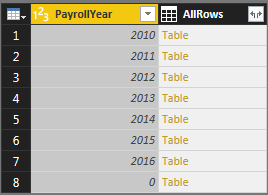
Here is the table after the TransformColumns call, with the new Employer Rate Rank column. This is the rank of the employer against all other employers in the same payroll year, based on AssessmentRate. (The rows above with 0 in the PayrollYear also have null AssessmentRate; all these rows have a null Employer Rate Rank.)
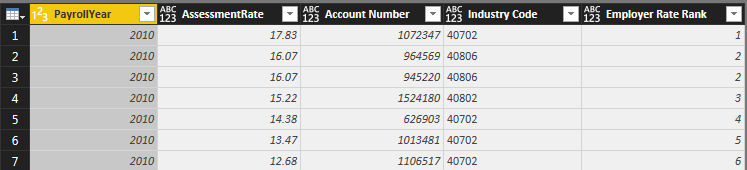
Now I group it by PayrollYear and Industry Code and call the RankingFunction again.
Here is the result, with the new Employer Rate Rank (Industry) column, which is the rank within the PayrollYear and Industry code.
Check out the source post here.
Thank you for reading this post! If you enjoyed it, I encourage you to check out some of our other content on this blog. We have a range of articles on various topics that I think you’ll find interesting. Don’t forget to subscribe to our newsletter to stay updated with all of the latest information on Imaginet’s recent successful projects

discover more

Integration Between Power Platform and SharePoint Encourages Innovation
Organizations are focusing on innovation, streamlining their processes, and delivering better experiences for employees and customers. Power Platform and SharePoint are the Microsoft products that are helping organizations focus on…

Mastering Subagents in VS Code + Copilot: How To Actually Use Them
If you’ve ever dumped a giant problem into Copilot Chat and watched the conversation slowly turn into spaghetti, subagents are the feature you’ve been waiting for. Think of subagents as…

5 Common Misconceptions About Cloud Migration: Debunking the Myths
We’ve all heard of the cloud and cloud migration. But how important is it actually for your business? Organizations are moving to the cloud for several reasons: to improve agility,…
Let’s build something amazing together
From concept to handoff, we’d love to learn more about what you are working on.
Send us a message below or call us at 1-800-989-6022.